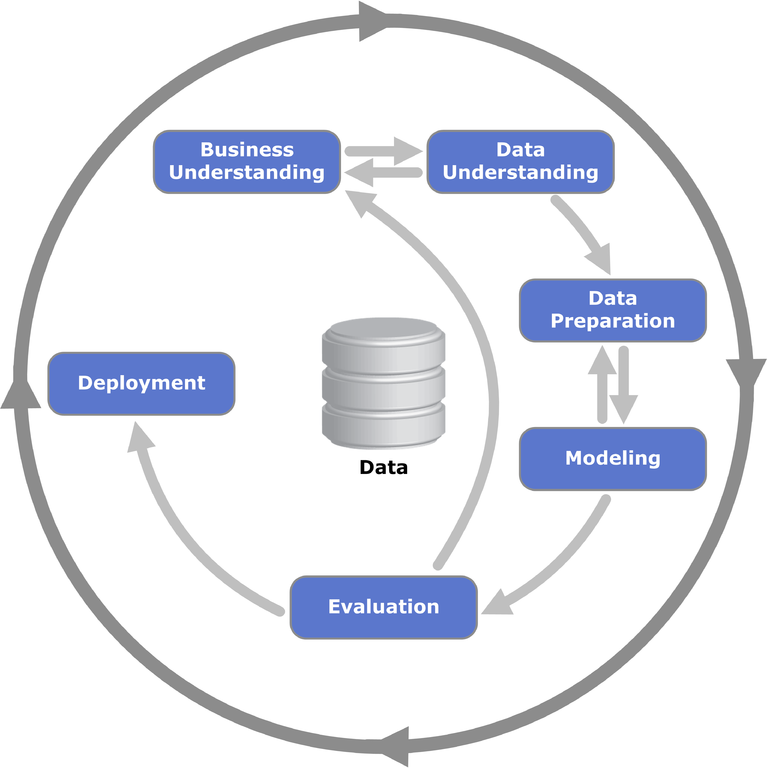
CRISP DM

Agile Methoden fürs Machine Learning
Über mich
- Marcel
- Software Entwickler bei CHECK24
- Speaker
- Co-Organisator des LNGN Agile Meetup

LNGN Agile Meetup
Themen
Treffen
- Moderne Softwareentwicklung
- Agile Methoden
- lngn-agile-meetup.github.io
Treffen
- Einmal im Quartal

CRISP DM
-
Cross-Industry Standard Process for Data Mining
- als Industriestandard konzipiert
- 1996 Entwickelt
- Offener Standard
Business Understanding
- Was sind die konkrete Ziele und Anforderungen?
- Grobe Vorgehensweise definieren
Business-Case
Hätte man auf der Titanic überlebt?
Hätte man auf der Titanic überlebt?
Data Understanding
- Analyse und Bewertung der Daten
- Mögliche Probleme der Datenqualität ermitteln
                        # Read the dataset
                        titanic.full = read.csv(file = "titanic.csv")
                        colnames(titanic.full)
                        # [1] "PClass"   "Age"      "Sex"      "Survived"   "Name"
                        summary(titanic.full) # Total of 1313
                         PClass         Age            Sex         Survived                 Name
                            :  1   Min.   : 0.17   female:462   Min.   :0.0000  Carlsson, Olof :   2
                         1st:322   1st Qu.:21.00   male  :851   1st Qu.:0.0000  Connolly, Kate :   2
                         2nd:279   Median :28.00                Median :0.0000  Kelly, James   :   2
                         3rd:711   Mean   :30.40                Mean   :0.3427  Abbing,Anthony :   1
                                   3rd Qu.:39.00                3rd Qu.:1.0000  Abbott, Joseph :   1
                                   Max.   :71.00                Max.   :1.0000  Abbott, Edward :   1
                                      NA's   :557                               (Other)        :   1304
Data Preparation
- Daten zu unserem Zwecke aufbereiten
- Konstruktion eines Datensatzes zur Modellierung
                        # Factorize the Survived Flag
                        titanic.full$Survived <- as.factor(titanic.full$Survived)
                        # Filter Men and Women
                        titanic.only_men = titanic.full[titanic.full$Sex=="male",]
                        titanic.only_women = titanic.full[titanic.full$Sex=="female",]

                        # Calculate the Median age
                        age.median_male = median(titanic.only_men$Age, na.rm = TRUE)
                        age.median_female = median(titanic.only_women$Age, na.rm = TRUE)

                        # Overwrite values with Median Age
                        titanic.full[
                          is.na(titanic.full$Age)
                          & titanic.full$Sex=="male", "Age"
                        ] = age.median_male
                        titanic.full[
                          is.na(titanic.full$Age)
                          & titanic.full$Sex=="female", "Age"
                        ] = age.median_female

                        # Remove the Name
                        titanic.full$Name <- NULL

                        titanic.full <- titanic.full[titanic.full$PClass != "",]

                        # Get the new summary
                        summary(titanic.full)

                        PClass         Age            Sex      Survived
                           :  0   Min.   : 0.17   female:462   0:862
                        1st:322   1st Qu.:26.00   male  :850   1:450
                        2nd:279   Median :29.00
                        3rd:711   Mean   :29.54
                                  3rd Qu.:30.00
                                  Max.   :71.00
Modelling
- Ermittlung des Modells
                        # Number of Rows
                        training.nrow = nrow(titanic.full)
                        training.size <- floor(0.75 * training.nrow)
                        # determine the dataset index
                        training.index <- sample(
                            seq_len(training.nrow),
                            size = training.size
                        )

                        # Split the full dataset in train and test data
                        titanic.train <- titanic.full[training.index, ]
                        titanic.test <- titanic.full[-training.index, ]

                        # install random Forest
                        install.packages("randomForest")
                        library(randomForest)

                        rf_result = randomForest(
                          formula = Survived ~ .,
                          data = titanic.train,
                          importance = TRUE,
                          ntree = 220,
                          nodesize = nrow(titanic.train)
                        )
Evaluation
- Wie gut ist unser Modell?
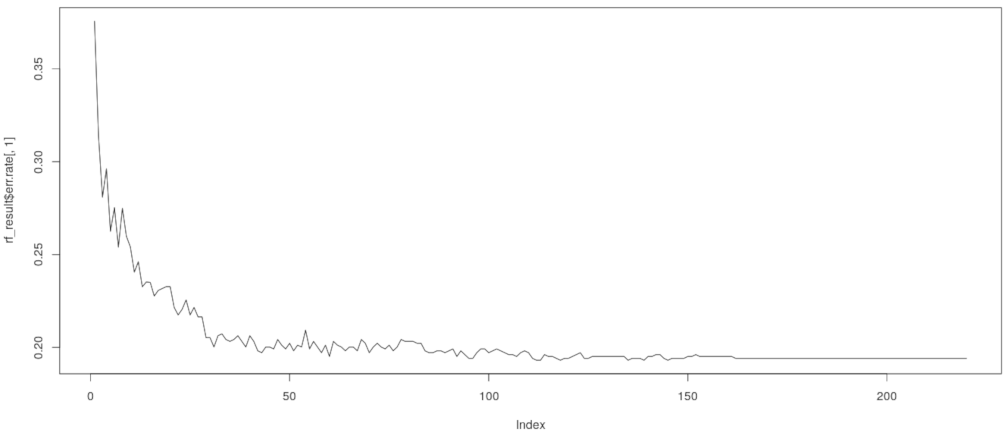
                        rf_result
                        # OOB estimate of  error rate: 19.41%
                        plot(rf_result$err.rate[,1], type="l")

Evaluation
                        # Run over the test Dataset
                        rf_predict = predict(rf_result, newdata = titanic.test)
                        confusionMatrix <- table(titanic.test$Survived, rf_predict)
                        confusionMatrix

                          rf_predict
                              0   1
                          0 215   5
                          1  48  61

                        # calculate accurate score
                        (confusionMatrix[1,1] + confusionMatrix[2,2]) / nrow(titanic.test)
                        # 0.83
Deployment
- Integration des Modells
- Test des Modells mit Nutzerdaten
- Lessons learned
Aber in unserem Fall
- Daten nicht ausreichend
- Modell liefert unzureichende Ergebnisse
Agile Ansatz
-
Erfahrungen aus dem Produktivbetrieb
- Kompletten Prozess wiederholen
Agile Ansatz
- Bessere Daten bereitstellen
- Business Case anpassen
Agile Ansatz
- Daten weiter aufbereiten
- Verfahren ändern / verfeinern
Daten
- Stehen im Mittelpunkt
- Ohne Datenbasis sind nur schwer gute Werte zu erzielen
Fazit
- Agile Prozesse für ML verwenden
- Stets den Business Case validieren
- Kleine Arbeitspakete deployen und testen
